We help creative foodies (like you!) take the guesswork out of building a food blog to share your passion and earn money doing what you love. Join the over 11,000 subscribers on our newsletter to get actionable tips and strategies delivered to your inbox each week! 📫
Pinch of Yum’s SEO Strategy: What Changed From 2024 to 2026
|
We're excited to send new Food Blogger Pro blog posts to you via email! We'll share our latest and greatest blog posts with you where we'll talk about tips and strategies for growing your audience, creating great food content, and monetizing your blog, as well as updates on new courses available for Food Blogger Pro members! Pinch of Yum’s SEO Strategy: What Changed From 2024 to 2026Published on September 24, 2026 If you read our recent post on Pinch of Yum’s traffic trends from 2024 to 2026, you’ve already got a pretty good idea of the key headline: search dipped slightly as a share of total traffic, but it’s still the biggest driver by far! That raises an obvious follow-up question: if search is still doing the heavy lifting, how is the Pinch of Yum team keeping it that way? That is an excellent question, and luckily for you, we recently sat down with them to dig into the strategy behind the numbers. Let’s get into it!
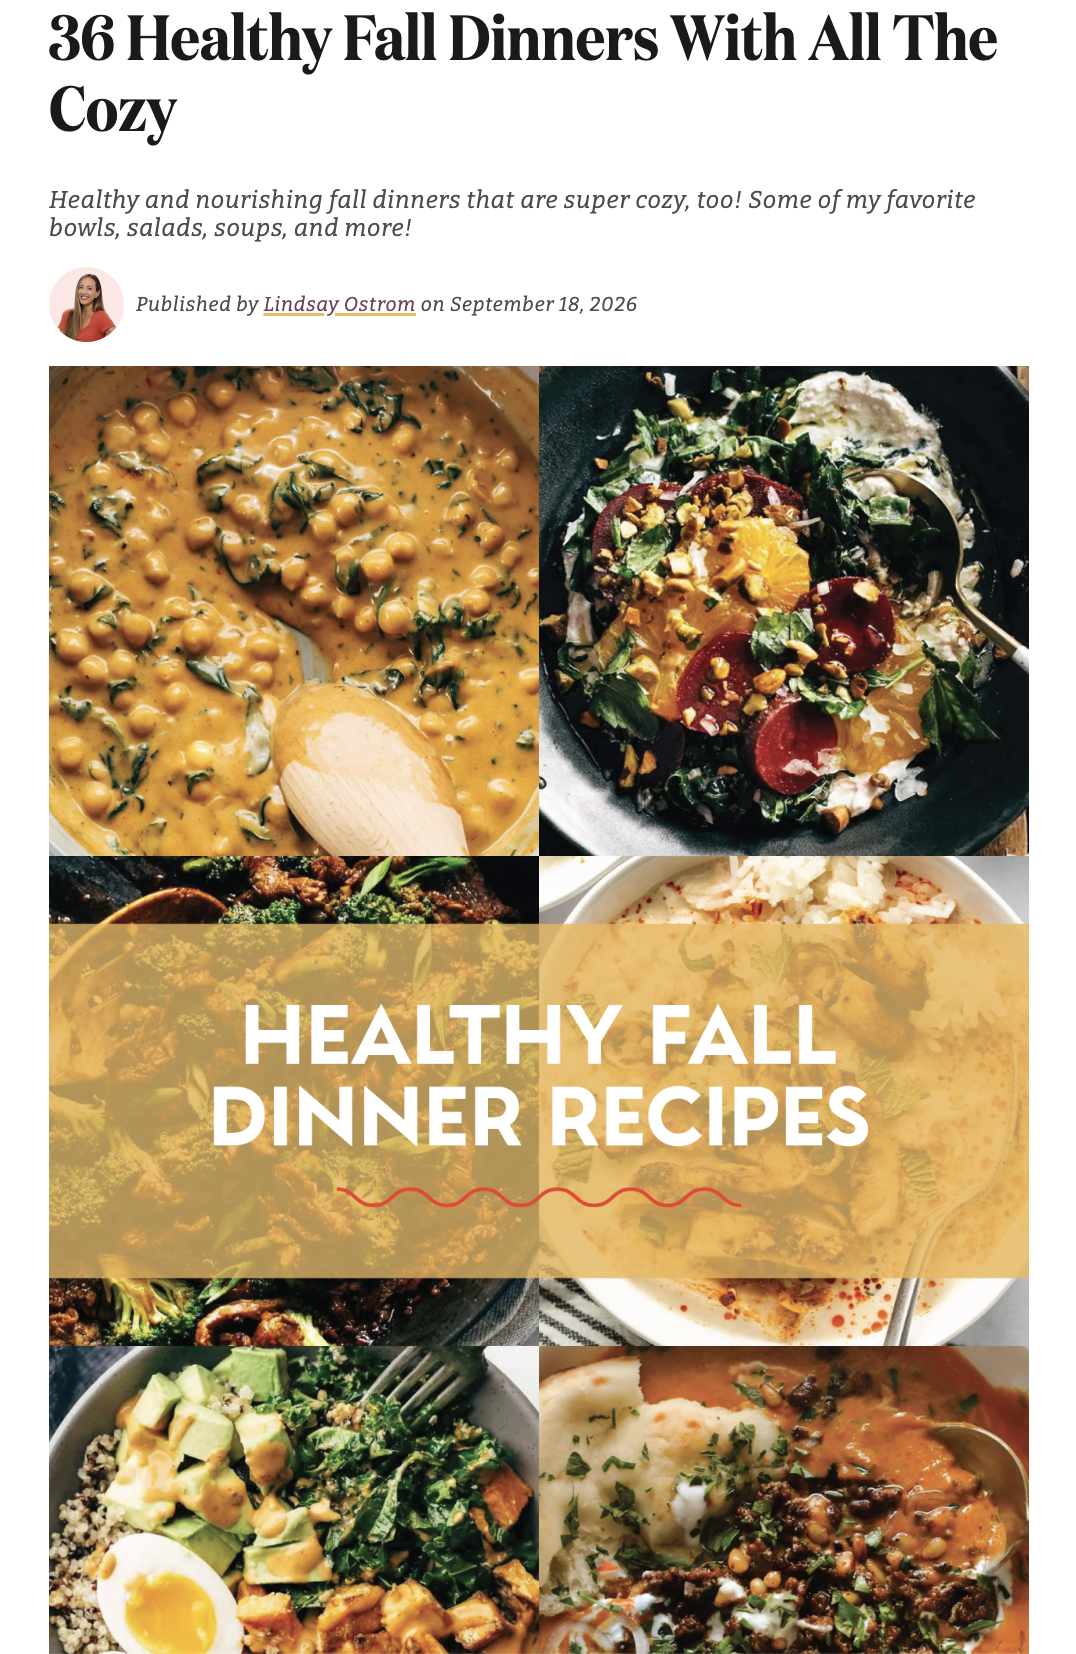
Quick methodology note before we dive in! Most the data below compares August 2024 to August 2026. A few of the metrics from Google Search Console had to use August 2025 as the earlier comparison point instead, since the tool only retains 16 months of data. We’ll be sure to call those out as we go! Search Traffic in Context: A Quick RecapSearch’s share of total traffic dropped from 67.7% to 54.7% between August 2024 and August 2026, a decline of roughly 13%. As for sessions coming from search, they saw a 24.5% decline over the same period. This is a pretty meaningful drop, but it’s likely that publishers across the space are seeing similar declines in search as the landscape is changing. Within search, Google remains dominant, moving ever so slightly from 99.0% to 98.4% of search sessions. Other search engines like Bing and DuckDuckGo picked up a bit of ground, but they still pale in comparison. So what exactly drove the shift in search traffic? There are a few forces behind it, and they’re worth talking about before we get into what Pinch of Yum is doing about them! Increased CompetitionSearch traffic didn’t just shrink as a share of the pie; it also declined in absolute terms, down roughly 24.5% year-over-year. This is quite a drop, but between increased competition in the recipe space and the prevalence of AI overviews (more on that below), we’re not all that surprised by it. The Rise of AI OverviewsI’m sure we all predicted this one (or perhaps we didn’t? We live in weird times now). The most striking pattern in the POY team’s data is that impressions roughly doubled year-over-year, while clicks dipped slightly. The combination of being shown far more often but not converting that visibility into proportionally more clicks indicates that AI Overviews are increasingly answering queries directly on the results page. We’ll dig into this in more detail in the Search Console section below. Changes in User Search BehaviorWhen we talk about search, it’s important to think outside of the box. It’s not just about how people find content; it’s what they do once they land on your blog! In Pinch of Yum’s case, both average engagement time and pages per session for organic search visitors went up (+8.6% and +5.7%, respectively) year-over-year. This is a really good sign overall, since it indicates that when people land on the site, they are genuinely interested in the content and engaging with it. A true testament to the great content that POY is putting out there! How Pinch of Yum Has Adapted Their SEO StrategySo! Now that we’ve painted a pretty good picture of POY’s search traffic landscape, here’s what the team had to say on the changes they’ve made to their SEO strategy. Leaning Into Roundup ContentOne of the most meaningful shifts in the data: roundup and list posts grew from a small slice of the pie (2.8% of top-page traffic) to a meaningful chunk (13.5%)—that’s nearly 1 in 7 pageviews among top-performing pages! 🤯 Recently published roundups (think seasonal dinner and recipe collections) are now landing in the site’s top 100 pages by traffic, a big shift from two years ago. One thing worth noting: this figure reflects traffic from all sources to those pages, not just organic search. Since organic search makes up the majority of traffic in both periods, though, it’s a pretty close read on what’s happening in search, too.
Doubling Down on E-E-A-TOver the past year, the team has put real effort into strengthening E-E-A-T (Experience, Expertise, Authoritativeness, Trustworthiness) signals across the site. They’ve taken steps to revamp Lindsay’s author page and adjust byline and publish/updated date formatting so it’s clearer to both readers and search engines who’s behind the content and how current it is. Hooray for humanity! 🙌 Prioritizing High-Impact Updates Over Small TweaksInstead of making minor edits across a large volume of posts (timesuck much?), they are focusing on fewer, more substantial updates by adding new features, reshooting photos, and re-testing and adjusting recipes rather than just refreshing a sentence or two. Quality > quantity! What the Search Console Data ShowsBy now, you’re probably thinking to yourself, “But where are the numbers?! We want to see the numbers!!!!” And to that, I say, “Allllllrighty then. Let’s get into these numbers. 😎” (Note: all Search Console figures below compare August 2025 to August 2026, due to Search Console’s data retention limits.) Clicks and ImpressionsTotal clicks were down slightly (−4.1%), while total impressions were up dramatically (+100.9%) over the same period. Read together, these two numbers point to a single underlying shift, which the CTR data below makes even clearer. ⬇️ CTR: The Clearest SignalSitewide click-through rate dropped from 3.3% to 1.6%, roughly cut in half. This pattern holds up at the individual query level, too: several queries show large jumps in impressions with clicks either flat or declining, even for queries where ranking position actually improved. That combination (ranking better, but getting clicked less) is a strong signal that AI Overviews and AI Mode are increasingly answering queries in place, without sending a click through to the site. Rankings: A More Complicated PictureSitewide average position improved substantially (by roughly two-thirds!), but this number can be a little misleading. A large wave of new pages and queries ranking for the first time is pulling up that sitewide average, while a closer look at the site’s already-established top queries tells a different story: 63.4% lost position, 29.3% gained position, and 7.3% held steady. In other words, Pinch of Yum is gaining a lot of new visibility, but among the queries it was already ranking well a year ago, it lost more ground than it gained. That’s an important nuance to take note of because a rising sitewide average doesn’t necessarily mean every part of the site is trending up! What This Means for Food BloggersSo now that we’ve broken this all down and we’ve read through all of the data, what narrative is this telling us exactly? You might be trying to piece this all together into something you can actually use, right? Here’s where we’d start:
What has your search traffic looked like in the last couple of years? Have you noticed a shift in clicks vs. impressions on your own site? What shifts have you made to your SEO strategy? Let us know in the comments below! This blog post, Pinch of Yum’s SEO Strategy: What Changed From 2024 to 2026, originally appeared on Food Blogger Pro. |
Food Blogger Pro
We help creative foodies (like you!) take the guesswork out of building a food blog to share your passion and earn money doing what you love. Join the over 11,000 subscribers on our newsletter to get actionable tips and strategies delivered to your inbox each week! 📫

This newsletter is sponsored by Raptive. Building a creator business isn't getting any easier. Between AI, constant platform changes, and the pressure to keep growing, it can feel like you're running just to keep up. That's why we're excited to partner with Raptive. Raptive works with thousands of the web's leading independent creators—including us—to help them earn more, grow smarter, and build sustainable businesses for the long term. They combine industry-leading advertising with...
This episode is sponsored by Clariti and Raptive. Welcome to episode 589 of The Food Blogger Pro Podcast! This week on the podcast, Bjork interviews Justin Ellen from Everything Just Baked. Justin Ellen started decorating and selling cakes in high school, with the dream of one day opening his own bakery. At the encouragement of his sister, he hesitantly started posting photos of his cakes on Instagram, but didn’t like being in front of the camera. He slowly but surely overcame his fear of...
This episode is sponsored by Clariti and Raptive. Welcome to episode 588 of The Food Blogger Pro Podcast! This week on the podcast, Bjork interviews Yoli Ouiya from Food + Wellness Equity Collective. In this week’s episode, Bjork is sitting down to chat with the "Queen of Green herself, Yoli Ouiya! Yoli breaks down what green living really means (hint: it’s about how the products we use affect both our bodies and the planet) and shares practical tips for making smarter choices around food,...